Pytorch (2-4) - 이상 날씨 탐지
다층 퍼셉트론 마지막 예제로 이상 날씨 탐지를 진행해보자.
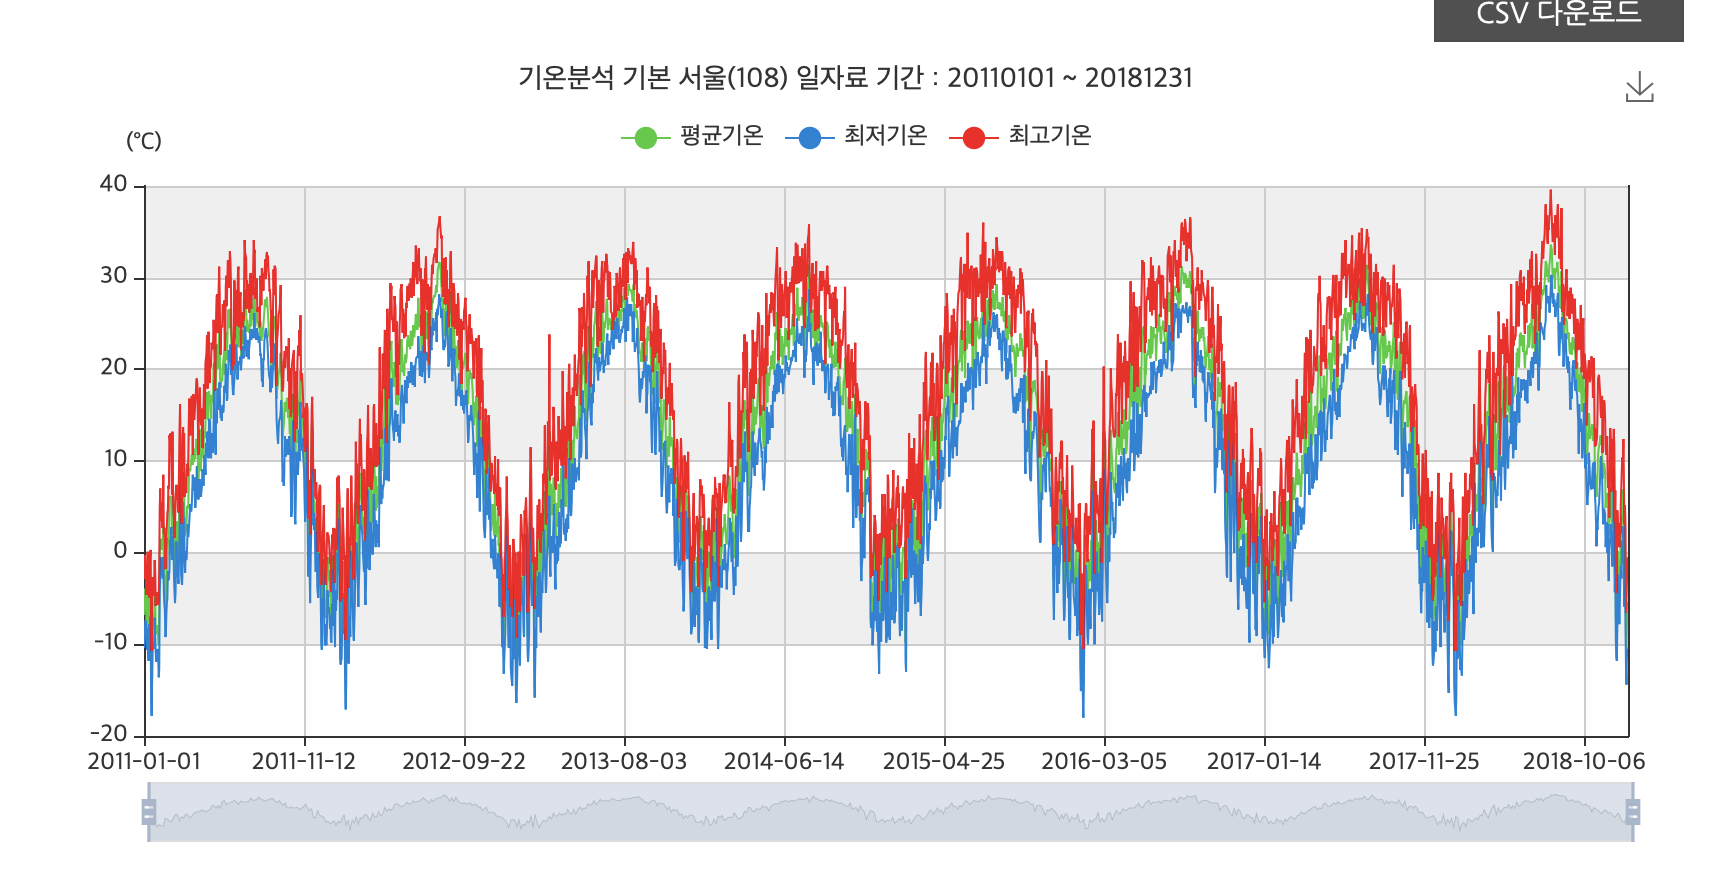
2011년 1월 1일 부터 2016년 12월 31일까지 서울시의 일 평균 기온데이터를 활용해 본다. 여기에서 데이터를 받을 수 있다.
import torch
from torch.autograd import Variable
import torch.nn as nn
import torch.nn.functional as F
import torch.optim as optim
from torch.utils.data import DataLoader, TensorDataset

import pandas as pd
import numpy as np

from matplotlib import pyplot as plt
%matplotlib inline


from google.colab import files
upload = files.upload()

import io

string_csv = io.StringIO(upload['ta_20190128205219.csv'].decode('euc-kr'))
data = pd.read_csv(string_csv, skiprows=[0, 1, 2, 3, 4, 5])
data.head()
| 날짜 | 지점 | 평균기온(℃) | 최저기온(℃) | 최고기온(℃) | |
|---|---|---|---|---|---|
| 0 | 2009-01-01 | 108 | -5.8 | -9.5 | -2.5 |
| 1 | 2009-01-02 | 108 | -2.8 | -6.9 | 1.2 |
| 2 | 2009-01-03 | 108 | -1.0 | -5.6 | 4.0 |
| 3 | 2009-01-04 | 108 | 0.4 | -2.8 | 4.5 |
| 4 | 2009-01-05 | 108 | -1.6 | -3.4 | 1.2 |
temp = data['평균기온(℃)']
temp.plot()
plt.show()
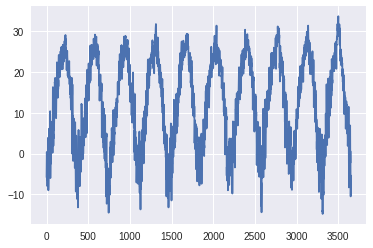
시계열로 데이터가 보인다.
train_index = round(len(temp) * 0.8)
train_x = temp[:train_index]
test_x = temp[train_index:]

train_x = np.array(train_x)
test_x = np.array(test_x)
시계열 데이터에서는 훈련데이터를 어떻게 만들어야 할까? 위에서 본 그래프에 따르면, 우리나라는 아름다운 4계절 국가이기 때문에 파도 형태로 온도가 요동치고 있다. (ㅠㅠ) 또한 당연한 얘기지만 부드럽게 움직이는 것이아니고, 요동치고 있기 때문에 이 데이터를 그대로 사용하게 되면 overfitting 문제가 발생할 가능성이 크다.
따라서 시계열 데이터를 다룰 때는, 일정 폭의 윈도우를 정의하고, 이 데이터를 따라 윈도우를 슬라이드 시켜 얻는 연속열을 통해서 훈련데이터로 삼아야 한다.

대략 이런 느낌
# 윈도우 크기 (180일, 6개월)
WINDOW_SIZE = 180

tmp = []
train_X = []

for i in range(0, len(train_x) - WINDOW_SIZE):
  tmp.append(train_x[i:i+WINDOW_SIZE])

train_X = np.array(tmp)

pd.DataFrame(train_X).head()
| 0 | 1 | 2 | 3 | 4 | 5 | 6 | 7 | 8 | 9 | ... | 170 | 171 | 172 | 173 | 174 | 175 | 176 | 177 | 178 | 179 | |
|---|---|---|---|---|---|---|---|---|---|---|---|---|---|---|---|---|---|---|---|---|---|
| 0 | -5.8 | -2.8 | -1.0 | 0.4 | -1.6 | -2.0 | -0.5 | -0.9 | -3.5 | -7.5 | ... | 22.7 | 25.1 | 23.0 | 23.4 | 24.5 | 24.8 | 24.4 | 26.1 | 26.0 | 26.1 |
| 1 | -2.8 | -1.0 | 0.4 | -1.6 | -2.0 | -0.5 | -0.9 | -3.5 | -7.5 | -8.0 | ... | 25.1 | 23.0 | 23.4 | 24.5 | 24.8 | 24.4 | 26.1 | 26.0 | 26.1 | 24.4 |
| 2 | -1.0 | 0.4 | -1.6 | -2.0 | -0.5 | -0.9 | -3.5 | -7.5 | -8.0 | -7.8 | ... | 23.0 | 23.4 | 24.5 | 24.8 | 24.4 | 26.1 | 26.0 | 26.1 | 24.4 | 23.5 |
| 3 | 0.4 | -1.6 | -2.0 | -0.5 | -0.9 | -3.5 | -7.5 | -8.0 | -7.8 | -5.5 | ... | 23.4 | 24.5 | 24.8 | 24.4 | 26.1 | 26.0 | 26.1 | 24.4 | 23.5 | 20.7 |
| 4 | -1.6 | -2.0 | -0.5 | -0.9 | -3.5 | -7.5 | -8.0 | -7.8 | -5.5 | -6.6 | ... | 24.5 | 24.8 | 24.4 | 26.1 | 26.0 | 26.1 | 24.4 | 23.5 | 20.7 | 22.5 |
이제 신경망을 구성하려고 한다. 이상탐지를 위해서, 자기부호화기 (auto encoder)를 사용하려고 한다. 다시한번 자기부호화기를 설명하자면, 입력층의 데이터를 압축하여 크기를 축소하고, 그렇게 해서 축소된 정보를 바탕으로 다시 원래 데이터를 복구하는 방법이다. 즉 이 신경망의 목표는 입력층을 암호화하고 다시 바로 복호화 했을때, 이 입력을 다시 제대로 복호화 할 수 있는 파라미터를 찾는 것이다.
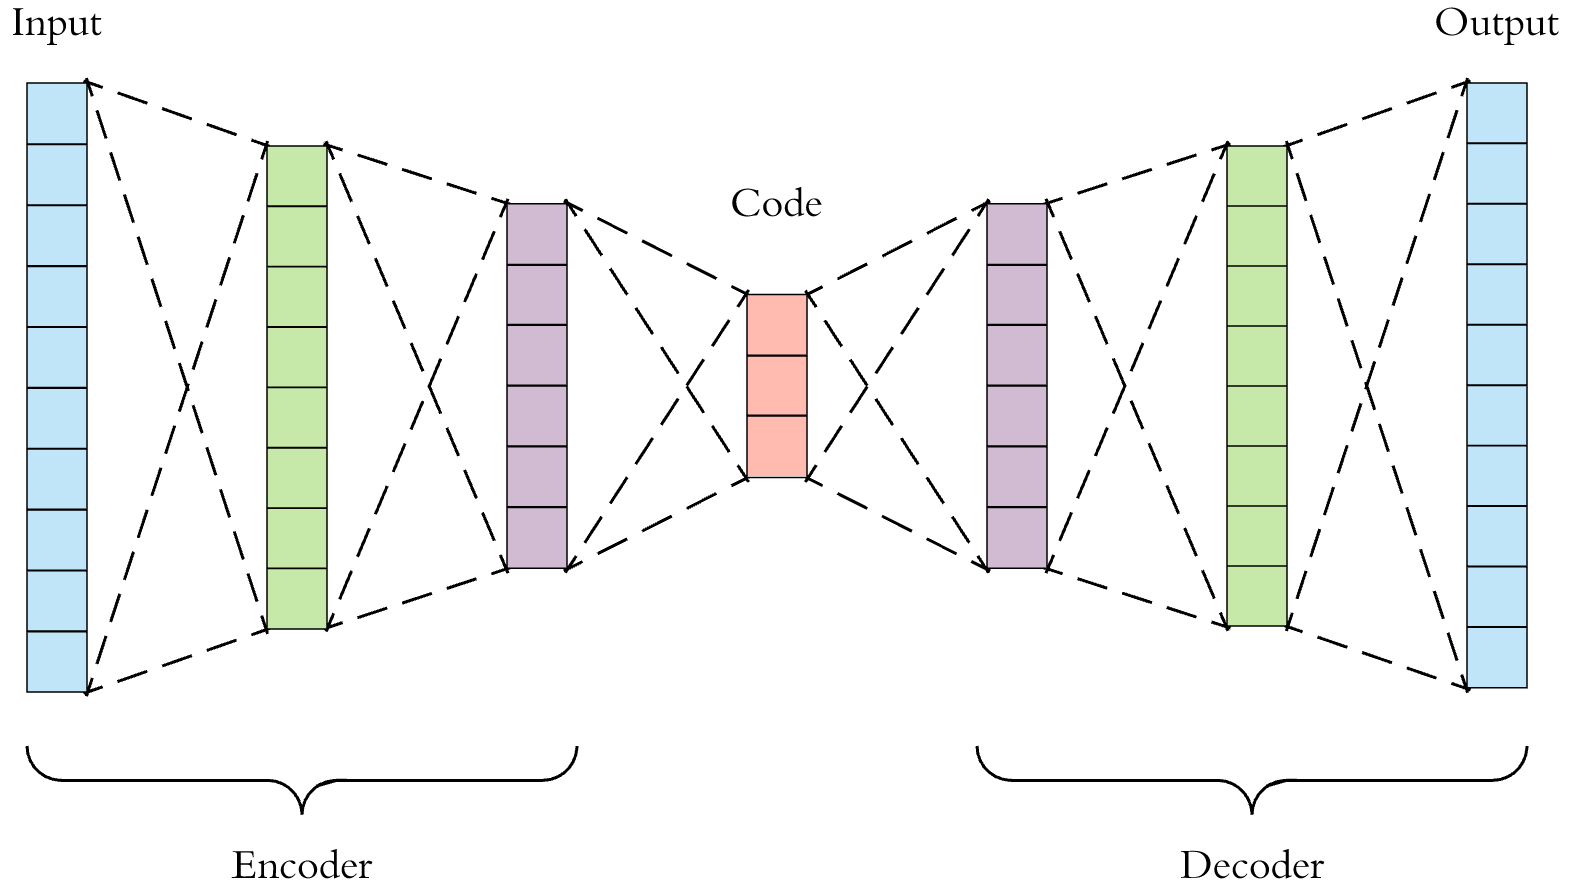
여기서 우리가 할 것은, 입력층과 출력층은 똑같이 (180개), 그리고 중간 층 3개에서 128, 64로 압축한뒤, 다시 128개, 180개로 복호화 하는 것이다.
class Net(nn.Module):
  def __init__(self):
    super(Net, self).__init__()

    self.fc1 = nn.Linear(180, 128)
    self.fc2 = nn.Linear(128, 64)
    self.fc3 = nn.Linear(64, 128)
    self.fc4 = nn.Linear(128, 180)

  def forward(self, x):
    x = F.relu(self.fc1(x))
    x = self.fc2(x)
    x = F.relu(self.fc3(x))
    x = self.fc4(x)

    return x;

model = Net()
모형학습
# 평균제곱 오차를 구한다.
criterion = nn.MSELoss()

# adam optimizer
optimizer = optim.Adam(model.parameters(), lr=0.001)

for epoch in range(1000):

  total_loss = 0
  d = []

  # 훈련 데이터를 미니 배치로 분할
  for i in range(100):
    # 훈련 데이터에 인덱스
    index = np.random.randint(0, 1281)
    # 미니 배치로 구성
    d.append(train_X[index])

  # numpy로 변환후 다시 Variable로
  d = np.array(d, dtype='float32')
  d = Variable(torch.from_numpy(d))

  optimizer.zero_grad()
  # 순전파
  output = model(d)
  # 오차
  loss = criterion(output, d)
  # 역전파
  loss.backward()
  # 가중치 업데이트
  optimizer.step()

  total_loss += loss.data.item()

  if (epoch+1) % 100 == 0:
    print(epoch+1, total_loss)
100 9.88106632232666
200 9.357300758361816
300 9.327717781066895
400 8.321449279785156
500 7.5223541259765625
600 7.002117156982422
700 6.586050033569336
800 6.0552496910095215
900 5.273303985595703
1000 5.39844274520874
결과값과 원래 데이터를 그래프로 보자.
plt.plot(d.data[0].numpy(), label='original')
plt.plot(output.data[0].numpy(), label='output')
plt.legend(loc='upper right')
plt.show()
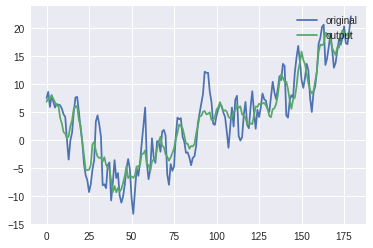
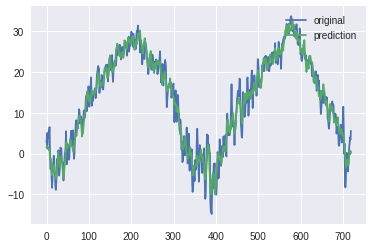
테스트 데이터 값과 테스트 데이터에 모형을 적용하고, 출력된 값을 확인
tmp = []
test_X = []

tmp.append(test_x[0:180])
tmp.append(test_x[180:360])
tmp.append(test_x[360:540])
tmp.append(test_x[540:720])

test_X = np.array(tmp, dtype='float32')

d = Variable(torch.from_numpy(test_X))
output = model(d)

plt.plot(test_X.flatten(), label='original')
plt.plot(output.data.numpy().flatten(), label='prediction')
plt.legend(loc='upper right')
plt.show()
test = test_X.flatten()
pred = output.data.numpy().flatten()

total_score = []
for i in range(0, 720):
  dist = (test[i] - pred[i])
  score = pow(dist, 2)
  total_score.append(score)

# 점수를 0과 1로 정규화
total_score = np.array(total_score)
max_score = np.max(total_score)
total_score = total_score / max_score

plt.plot(total_score)
plt.show()
